
Variability in your pressure-volume (PV) measurements can be introduced at any stage of the experiment, from your catheter placement to your analysis software. Understanding how and where these issues can arise is essential to troubleshooting the problem or preventing it from happening in the first place!

In this blog, DeWayne Townsend (DVM, Ph.D.), a cardiovascular physiologist from the University of Minnesota Medical School, provides expert advice on common sources of signal variability, important considerations in your experimental design, plus handy tips and tricks for collecting high-quality PV loop data.
Overview
- Fluid management - Blood loss and insensible fluid loss
- Surgical artifacts - Papillary entrapment
- Respiratory artifacts - Effects of positive pressure ventilation
- Modulating cardiac loading - IVC occlusions and abdominal compressions
- Analysis issues - Baroreceptor reflex and loop rejection
Note: the information provided below is primarily focused on the acquisition and analysis of left ventricular PV loop data in a mouse model.
Fluid loss in small animals
One thing you need to be particularly aware of when working with mouse models is their size. Not only does the surgery become more fiddly when working with smaller structures and instrumentation, but you can also run into issues with fluid loss.
There are two primary sources of fluid loss in PV loop experiments - blood loss and insensible fluid loss, the latter of which refers to the evaporation of water during respiration and exposure of tissue. Below are some tips for managing fluid loss during your PV surgeries.
Avoid performing experiments on animals smaller than 20 g
Generally, we won’t perform PV loop experiments on animals smaller than 20 grams. This is for a couple of reasons: a) Their hearts are too small (making surgical procedures difficult), and b) They have so little blood volume that even with the standard surgical procedures, you can end up losing a fair amount of blood. Loss of blood from the circulatory system can become hemodynamically significant when you come to measure your PV loops.
Use cautery and Q-tips to prevent fluid loss
Blood loss is usually prevented through careful surgery, in combination with techniques such as cautery (thermo or electro) to maximize homeostasis. In places where you don’t want to use cautery, you can use cotton-tipped applicators or Q-tips. Not only do they allow you to apply direct pressure to the bleeds, but they can also give you a rough estimate of how much blood has been lost - aiding in fluid replacement and experimental reproducibility. One Q-tip translates to about one hundred microliters of blood.
Replace lost fluids intravenously
In any PV experiment, we replace lost fluids intravenously using a solution of 10% albumin in 0.9% saline. Being a colloid solution (has a high oncotic pressure), it will bring fluid into the circulatory system. At baseline, we usually administer five ml/kg. However, if there's significant blood loss i.e., more than a couple of Q-tips, we'll add more.
The amount of circulating fluid within the mouse will determine the preload within the heart. So the closer you can get that preload to be consistent from mouse to mouse, the more consistent your data will be and the fewer animals you need to use to be able to identify any significant effects.

Surgical artifacts
Internal cardiac structures can interfere with your pressure signal
Upon placement of the catheter in the ventricle, what can sometimes happen is a bit of the heart tissue, e.g, a papillary muscle or chordae tendineae, can stretch across the pressure transducer. In such instances, these internal structures can interfere with the pressure tracing as the heart contracts.
Often you will end up with a pressure recording that has an abnormal spike at the end of systole where the tissue is compressing down on the force transducer.
Adjusting catheter placement
If you are fortunate enough to notice this abnormality near the beginning of your experiment, you have the option to adjust the position of your catheter. Note, the aortic (closed chest) approach makes it more challenging to adjust the catheter position because of the angle at which it enters the ventricle compared to the apical approach.
Find out more: Millar PV catheters for small and large animals
Respiratory artifacts
Ventilation alters left ventricular preload
The next thing we are going to touch on is the notion of respiratory artifacts. We usually use an open-chest model, which, as mentioned above, requires the mouse to be ventilated. It’s important to understand that positive pressure ventilation creates a respiratory dependent oscillation in left ventricular (LV) pressure.
If you look at the figure in the video above, you can see how ventilation is subtly changing the preload of the left ventricle. These slight oscillations in LV pressure can make it challenging to measure your steady-state parameters.
Briefly turn off the ventilator to collect data without respiratory artifacts
One way to get around this is to briefly turn off the ventilator to induce a short period of apnea. By shutting off the ventilation for a few seconds prior to, and during an occlusion, you can acquire contractile data without lung motion artifacts. This provides you with a series of PV loops from which you can accurately analyze and derive your load-independent measures.
Modulating cardiac loading in mice
Measuring load-independent parameters of contractility is one of the main advantages of PV Loop analysis. By simultaneously collecting pressure-volume data in real-time, you have the unique advantage of being able to measure hemodynamic changes in response to varying loading conditions on the heart. Below we will discuss two methods for modulating cardiac loading in mice.
Inferior vena cava occlusions (IVCO)
Reductions in preload through IVC occlusions are the gold standard for assessing load-independent measures of contractility across small and large animal models. However, there are some factors that need to be considered when changing cardiac loading in smaller hearts, i.e., rodents.
In large animals, there's a fair amount of what we call ‘systolic reserve.’ This means when you occlude the IVC or reduce the preload, there's an extended period over which the end-diastolic volume can drop, and pressures are relatively maintained.
However, in rodents, this ‘systolic reserve’ isn’t as apparent. By looking at the figure on the right, you can see that as we decrease the IVC return, the end-diastolic volume starts to decline, until eventually, the whole PV loop begins to shrink.
As you get down to ~50-75mmHg, you begin limiting perfusion to the heart, resulting in this curvilinear response. This can be problematic when you're trying to assess the contractility from these series of loops, as it is difficult to determine whether you are measuring the true end-diastolic/systolic relationship or an artifact.
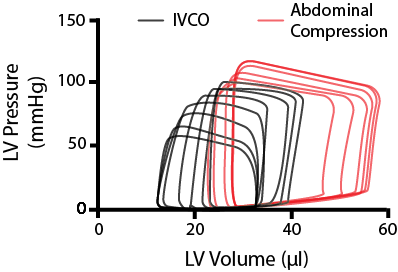
Stylized image of modulating cardiac loading on a mouse the heart through IVCO and abdominal compressions.
Abdominal compressions
One thing we do in our group is when we want to alter preload, we do it in both directions. After using an IVC occlusion to reduce preload, we perform what is called an abdominal compression. As implied by the name, abdominal compressions involve briefly pushing down on the abdomen of the mouse. This will do two things; increase the preload, by squeezing a little bit of blood back into the heart, and increase the afterload on the left ventricle as you press down on the aorta - as represented by the red PV loops in the figure above.
By using IVCO in combination with abdominal compressions, you can assess the passive dynamic properties of the heart over a broader range of end-diastolic volumes.
Analysis Issues
Accounting for the baroreceptor reflex
An important consideration when acquiring your PV loop data is to pause for 10-15 seconds after an inferior vena cava occlusion. The reason being, when you perform an IVCO, you cause a drop in systemic blood pressure, activating the baroreceptor reflex. The baroreceptor reflex is the body's mechanism for regulating acute changes in blood pressure (BP).
In response to this sudden drop in BP, the body will respond by increasing the sympathetic nervous system output to the heart. Therefore, any measurements taken immediately after an occlusion will have increased contractility due to this endogenous sympathetic activation.
On the other hand, with abdominal compressions - as you push down on the heart, a pulse of high pressure is sent up to the baroreceptors, which respond by periodically withdrawing sympathetic tone. So anytime you modulate preload, it’s important to make sure that you wait for your signals to stabilize before you do any steady-state measurements.
Loop rejection
Another factor to take into consideration during analysis is loop rejection. No scientist likes to throw away data, but sometimes natural events such as an arrhythmic beat will happen during a period of measurement and skew your data. The data from these loops will be outliers and should be removed.
In saying this, removed loops should still be recorded, and the original data maintained to preserve the integrity of the data workflow. This is particularly important if you're working with clinical data.
We hope you found this information helpful! For more information about PV Loop data acquisition and analysis, check out Dr. DeWayne Townsend and Dr. Adam Goodwills' full webinar on tips and tricks for cardiac PV loop analysis.
Additional resources:
Surgical Instruction Video Series: Pressure Volume (PV) and Invasive Pressure
Importance of PV Catheter Calibration in Admittance and Conductance Systems
Troubleshooting your Millar Catheter: The three common problems and how to fix them
Best practice tips for Millar pressure-volume catheters
Understanding Ventricular Pressure-Volume Catheter Calibrations and Experimental Design
Optimizing your pressure-volume recordings in LabChart

DeWayne Townsend, DVM, PhD
Associate Professor, Department of Integrative Biology and Physiology
University of Minnesota Medical School
My laboratory utilizes an integrative approach to study the pathophysiological mechanisms of heart failure, with a specific focus on dystrophic cardiomyopathies.
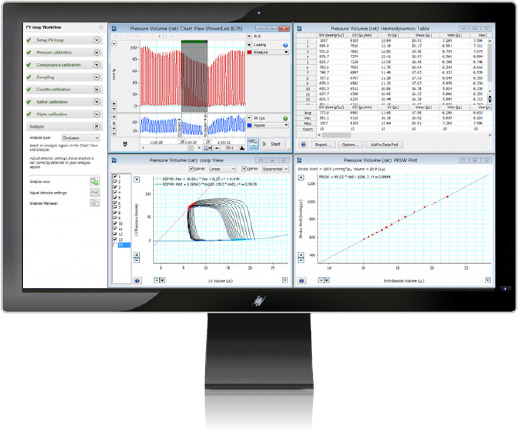
LabChart - PV Loop 2.5 for left and right ventricle studies
The PV Loop Analysis Software Module for LabChart is specifically designed for the analysis of in vivo ventricular pressure-volume data in small and large animals, or ex vivo, using working heart systems. Our PV loop module provides workflows for acquiring PV loop data from small and large animal models as well as tools for analyzing left and right ventricular PV data in real-time or post-acquisition. Contact us for more information.