During last year's summer season a group of researchers from New Zealand and Sweden took PowerLab to Antarctica, where it was used to assess the effects of climate change on notothenioid fish cardiovascular and respiratory physiology.
Ecologists have generally considered Antarctic fish as extreme stenotherms, unable to compensate for even small changes in water temperature. This makes them particularly vulnerable to climate change, with temperature changes already affecting the distribution of animals in the Southern Ocean.

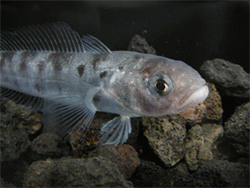
Antarctic notothenioid species Pagothenia borchgrevinki, commonly known as borch.
However, recent research has suggested that at least some Antarctic notothenioid species are able to tolerate and even acclimate to increased temperatures. Fish have displayed major changes in swimming capacity, cardiac function and enzyme activity, and may need as little as a week to acclimate.
Climate Change and Cardiac Physiology
To find out more about this process, Professor Bill Davison from New Zealand's University of Canterbury is coordinating the Temperature and Cardiovascular Physiology of Antarctic Fish project. This program seeks to investigate the mechanisms behind the fishes' acclimation. As the uptake of oxygen and its distribution are fundamental to survival, the program particularly focuses on the cardiovascular and respiratory system.
Professor Davison has used PowerLab systems in his work at the New Zealand Antarctic marine station for more than 10 years. In addition to the latest 30 series PowerLab units, Professor Davison continues to use a PowerLab 400 as part of the project.
In 2007, Professor Michael Axelsson and Dr. Erik Sandbloom from Sweden’s University of Gothenburg joined Professor Davison at the Scott Base research station in McMurdo Sound, Antarctica.
Research at Scott Base
During their stay at the world’s most southernly located marine research station, the researchers set up their equipment, including several PowerLab systems, Transonic flow meter pressure recording units and laptop computers, to study the fish Pagothenia borchgrevinki, more commonly known as the borch.
The borch typically swims just under the ice that covers the McMurdo Sound's deep ocean water, in temperatures of approximately –1.86°C . To gather specimens for the study the researchers first needed to drill through 4 meters of solid sea ice, then use "skill and luck to get the fish," says Professor Axelsson.
Projects undertaken by the research group included:
The effects of acclimation to 4°C on the response to hypoxia. This involved comparing the heart rate and ventilation of a group of fish that had been acclimated to 4°C for several weeks with a group kept at their normal temperature. This is important for the understanding on how these animals might be affected by changes in the environmental temperature.
The effects of venous pressure on the borch cardiovascular system. This was explored to advance understanding of the overall control of the cardiovascular system in fish with the body temperature of -1.86°C.
The effects of feeding on gastrointestinal blood flow and its regulation. This project examined the mechanisms that control blood flow to the gastrointestinal tract. It was the first study of cardiovascular dynamics after feeding in any Antarctic fish species. Left: Experimental set-up of the gastrointestinal blood flow study. PowerLab system and Transonic flow meter are shown in the top right corner.
To unravel the mechanisms responsible for the changes in the fish, the research is taking an integrated approach. These investigations of cardiovascular function in whole animals will serve as a baseline for studies at the organ and tissue levels, and ultimately at the cellular and molecular levels.

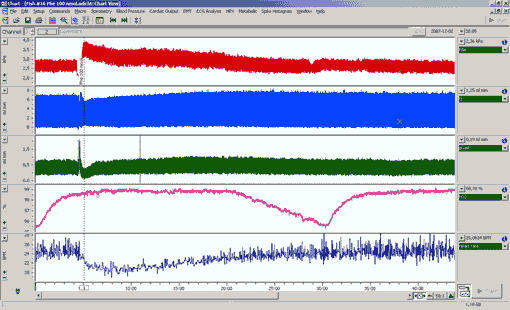
LabChart 5 screen capture displaying the results of a Phenylephrine injection into a 135 gram borch. From top: dorsal aortic blood pressure, cardiac output, gastrointestinal blood flow, oxygen tension in the respirometer and heart rate.