
Pressure-volume (PV) loops are the gold standard for measuring direct, real-time cardiac function. By simultaneously plotting real-time ventricular pressure against ventricular volume, PV loops provide a unique, quantitative approach for determining the contractility of heart independent of preload and afterload.

In this blog, Cardiovascular Physiologist Adam Goodwill (P.h.D) from Indiana University School of Medicine, provides a comprehensive introduction to the PV loop, how it compares to other techniques, and tips for interpreting measures of cardiac function.
Overview
Watch Now: Expert tips for measuring PV Loops in mice
Why study PV loops? What are the alternatives?
There are a variety of invasive and non-invasive technologies available for assessing cardiac physiology. However, echocardiography, cardiac MRI, and pressure-volume (PV) catheters are the three most commonly used techniques for measuring cardiac function in mice. Mary Lindsey (2018) published an excellent paper reviewing the pros and cons of these various modalities, which we will briefly highlight in the video below.
Echocardiography and Cardiac MRI
Echocardiography and cardiac MRI are the two primary non-PV modalities used for assessing cardiac function in mice. As with any tool, they have their advantages and disadvantages, but what you find in common between the two is the ability to perform serial measurements and assess cardiac chamber structure.
Echo is generally more available and portable than MRI. However, MRI will give you better blood tissue contrast and greater spatial resolution. Another appealing aspect to echo is that it can be performed on conscious animals. Although, this comes with a notable caveat, being that significant acclimation needs to occur before recording any data, as the stress of the procedure can introduce experimental bias.
Each system has its own unique set of limitations highlighted in the video above, but two that they hold in common are they only capture data over short periods, and that cardiac functional measures are largely load-dependent.
These limitations are what set PV catheters apart from echo and MRI, as you can simultaneously collect load-dependent AND load-independent data throughout the entire experiment.
PV Catheters
Pressure-volume catheters provide a unique method for acquiring hemodynamic and contractile data directly from the heart. By inserting a PV catheter into the left or right ventricle of an anesthetized animal, you can measure all load-dependent data for every cardiac cycle from the moment you complete your instrument until the end of the experiment.
The video below shows a handful of commonly reported cardiac parameters that can be measured with a PV catheter.
Similar to echo and MRI, PV catheters allow you to measure end-diastolic volumes and end-systolic volumes, and from these, calculate the stroke volume, ejection fraction, and cardiac output. You can also calculate parameters such as stroke work, Tau, dP/dt Max and Min, contraction time, and relaxation time - all of which are associated with the term 'contractility.'
Related: Importance of PV Catheter Calibration in Admittance and Conductance Systems »
However, these parameters are all considered to be load-dependent (influenced by the preload or afterload of the heart), whereas true contractility is a load-independent phenomenon. To understand how we measure load-independent measures of contractility with a PV catheter, we must first understand the PV Loop.
Understanding the Pressure-Volume Loop
PV catheters record the change in ventricular pressure and volume during a cardiac cycle (or heartbeat). When plotted against each other, these pressure-volume measurements form what is known as a pressure-volume loop.
PV loops are always presented with the ventricular volume on the x-axis and the ventricular pressure on the y-axis. The video below provides a walkthrough of the cardiac events that take place in the left ventricle to form a single PV loop.
Related: PV Catheter placement in the left ventricle
Points on the PV Loop
If we begin at point C on the graph to the right, we have just completed diastole (filling phase). The ventricles are full of blood and ready to begin systole.
As the ventricle starts to contract, the mitral valve closes and we move from points C to D. During this phase, the heart generates a change in pressure without altering the ventricular volume - this is known as an iso-volumetric contraction.
When the pressure in the ventricle exceeds the pressure in the aorta, the aortic valve will open, and we begin our ejection phase. This is where the line begins to move from D to E. During this phase, pressures are still being generated until a peak systolic pressure is reached at point E.
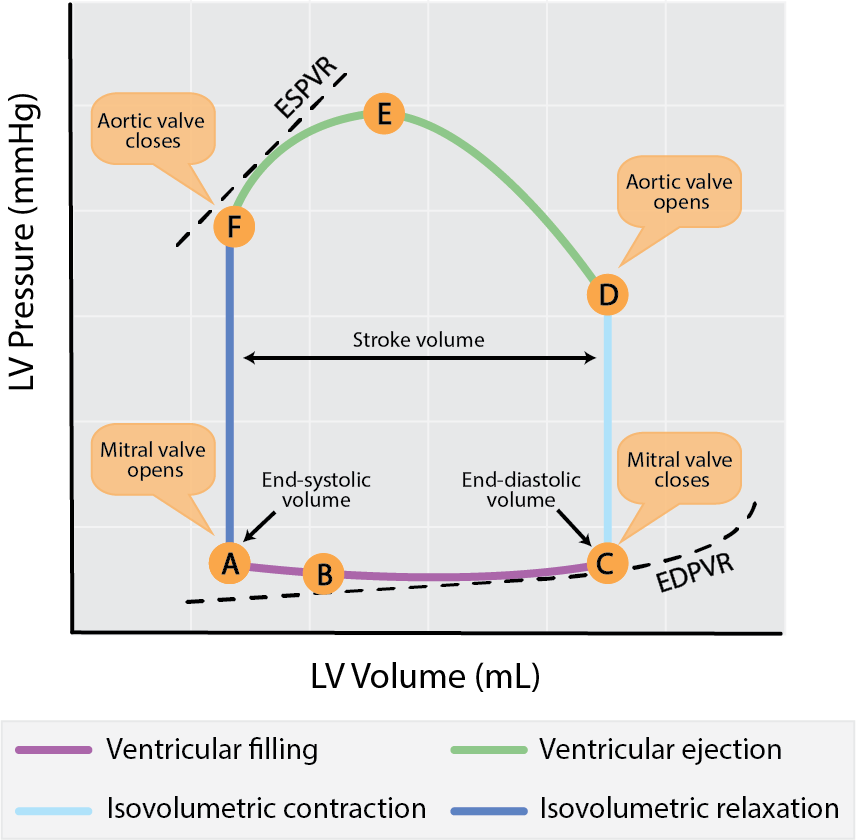
Points on the PV Loop. Adapted from Boron, Walter & Boulpaep, Emile. Medical Physiology 2nd Edition.
As the ventricle exhausts its capacity to contract and begins to relax, the pressure within the chamber is going to drop below that of the aorta. The aortic valve then closes. It's at this point that we've completed systole and begun diastole. We can consider this to be our end-systolic pressure-volume point (this will become an important reference later on).
As the ventricle relaxes with all the valves closed, the pressure within the ventricle will drop while the volume remains constant - this is our isovolumetric relaxation. This will continue until the pressure within the ventricle is less than that at the atrium, at which point the mitral valve will open and the ventricle will begin to fill (point A to C), concluding our cardiac cycle.
Load-independent measures of cardiac function
Measuring load-independent parameters of contractility is one of the main advantages of PV Loop analysis. By simultaneously collecting pressure-volume data in real-time, you have the unique advantage of being able to measure hemodynamic changes in response to varying loading conditions on the heart.
Preload reductions (IVC occlusions)
Preload reductions through an inferior vena cava (IVC) occlusion is the gold-standard method for obtaining load-independent measures of contractility. Preload is the amount of stretch that a ventricle experiences prior to a contraction.
By obstructing the return flow of blood to the heart, you can generate a series of PV loops (shifting leftwards) over a range of decreasing ventricular preloads, as indicated by the figure on the right.
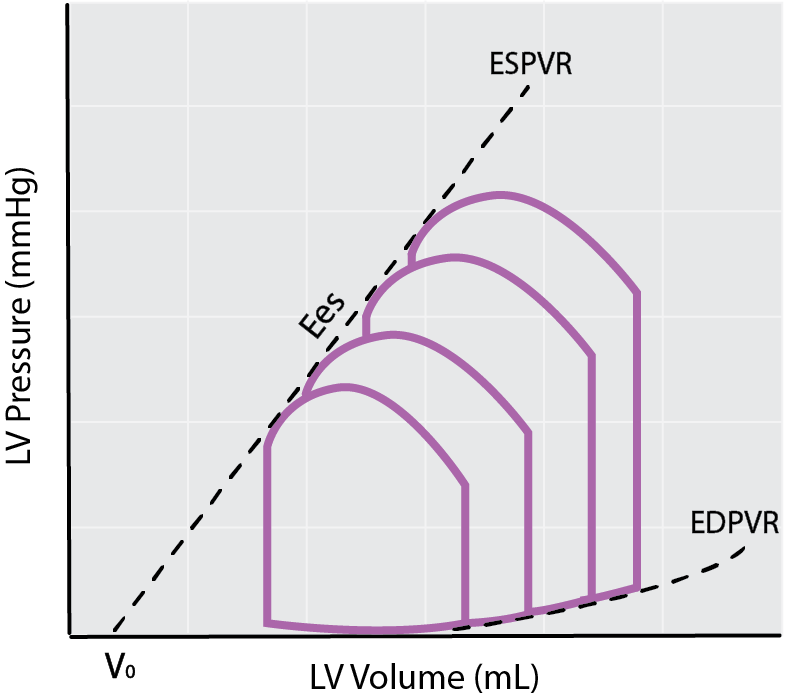
Schematic of preload reductions using an IVC occlusion to calculate the EDPVR, Ees, and EDPVR.
Each of these loops has its own unique end-systolic and end-diastolic point. These individual points can be used to obtain the end-systolic pressure-volume relationship (ESPVR) and end-diastolic pressure-volume relationship (EDPVR), which are considered load-independent measures of cardiac contractility and compliance, respectively.
Find out more: Experts tips for modulating preload in mice
ESPVR
The end-systolic pressure-volume relationship represents the maximal pressure developed by the LV at any given volume and is a measure of cardiac contractility. The slope of ESPVR, also referred to as Ees, is an index of end-systolic elastance and provides information on contractile function.
Cardiac contractility is the innate ability of the heart muscle (cardiac muscle or myocardium) to contract, independent of preload. Therefore, a change in Ees can be viewed as a change in contractility.
An increase in the Ees slope relative to the control state indicates a positive inotropic response (increase in contractility), whereas a decrease in slope reflects a negative inotropic response (decrease in contractility). The degree at which the slope of the ESPVR has changed can give you information about the overall health of the heart and be used to characterize certain cardiac disease states.
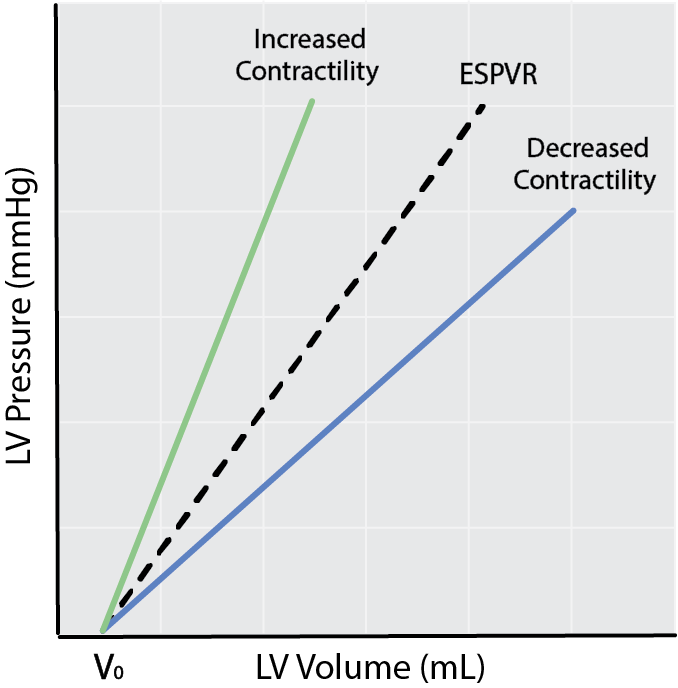
Schematic of ESPVR and changes in cardiac contractility.
EDPVR
During your preload reductions, you will also notice a downwards shift in the end-diastolic point of each loop. When plotted, these points create what is known as the end-diastolic pressure-volume relationship (EDPVR).
The EDPVR is a curvilinear relationship that can give you information about the compliance of the heart (how easily the ventricle expands as it fills with blood).
Left ventricular compliance is the reciprocal of the EDPVR slope. Therefore decreased compliance is indicated by and upwards shift of the EDPVR (this can also be thought of as increased ventricular stiffness), and increased compliance is represented by a downwards shift of the EDPVR.
Accurate calculation of the EDPVR through preload reductions is important, as a change in ventricular compliance is characteristic of certain disease states such as ventricular hypertrophy (decreased compliance) or dilated cardiomyopathy (increased compliance).
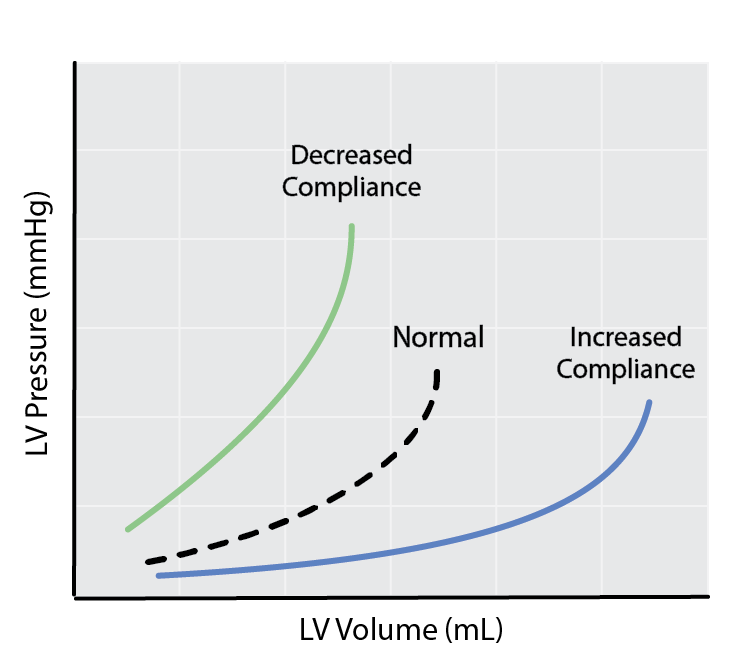
Schematic depicting changes in left ventricular compliance as a result of changes in the slope of the EDPVR.
Find out more: LabChart PV Loop analysis software - Automatic detection of ESPVR and EDPVR
Cardiac energetics
The ESPVR and EDPVR are central to understanding the relative efficiency of which the heart is operating. Often this type of analysis is underutilized in the literature - but that doesn't make it any less important.
Measurements of mechanical efficiency
If we look at the figure of the PV loop below, we can see that we have two distinct areas labeled PE and EW. One area is defined by the PV loop itself, whereas the second ‘triangular’ area to the left to the PV loop is bound by the ESPVR and EDPVR.
External Work (EW)
If we integrate the area inside the PV loop, we get what is called External Work (EW) or Stroke Work (SW). This can be thought of as the work done by the ventricle to eject blood into the aorta.
Potential Energy (PE)
When we examine the pseudo triangular space to the left of the PV loop, we can find the Potential Work or Potential Energy (PW/PE). This can be thought of as the energy generated within a contraction that is NOT converted to external work i.e. the energy required to stretch and lengthen viscous elements in the ventricles (e.g. pumping calcium).
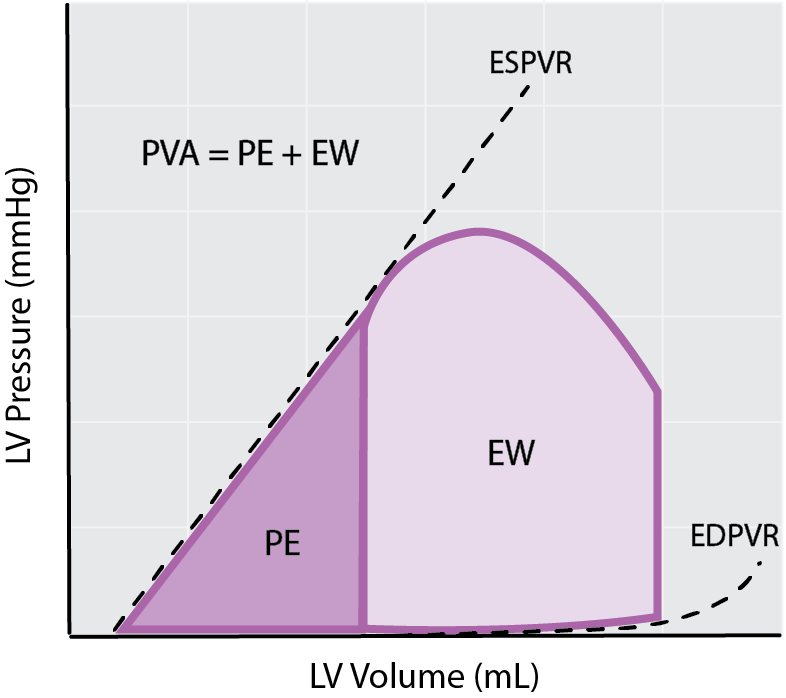
Measurements of cardiac efficiency from the PV loop: External Work (EW), Potential Energy (PE) and Pressure-Volume Area (PVA).
Pressure-Volume Area (PVA)
The summation of external and potential work is your Pressure-Volume Area (PVA). The PVA is the sum of all of the heart's work and is proportionate to myocardial oxygen consumption, as an increase in PVA will come with accompanying increases in myocardial oxygen consumption, and vice versa.
If you compare two hearts that show a similar PVA, the heart that has a greater amount of external work performed per total pressure-volume area, (which can also be thought of as greater external work relative to potential work) would acquaint to a more efficient heart, as more blood is being pumped for the same total energy.
These calculated parameters can give you information about how much work the heart is doing i.e. Cardiac Power (External Work x Heart Rate) and how efficiently it’s performing that work, also known as Cardiac Efficiency (External Work per unit energy consumed).
We hope you found this information helpful! For more information about PV Loop data acquisition and analysis, check out Dr. Adam Goodwills and Dr. DeWayne Townsend's full webinar on tips and tricks for cardiac PV loop analysis.
Additional resources:
Best practice tips for Millar pressure-volume catheters
Understanding Ventricular Pressure-Volume Catheter Calibrations and Experimental Design
Introduction to PV loops: Understanding points on the PV loop and measures of cardiac function
Surgical Instruction Video Series: Pressure Volume (PV) and Invasive Pressure
Troubleshooting your Millar Catheter: The three common problems and how to fix them

Adam G. Goodwill, PhD
Assistant Research Professor, Anatomy Cell Biology & Physiology
Indiana University School of Medicine
The majority of my research career has focused on vasomotor deficits and vascular remodeling in the context of metabolic syndrome.

Need more information?
We’re experts in helping you find the right tools for your research. Contact us to discuss your research and workflow.