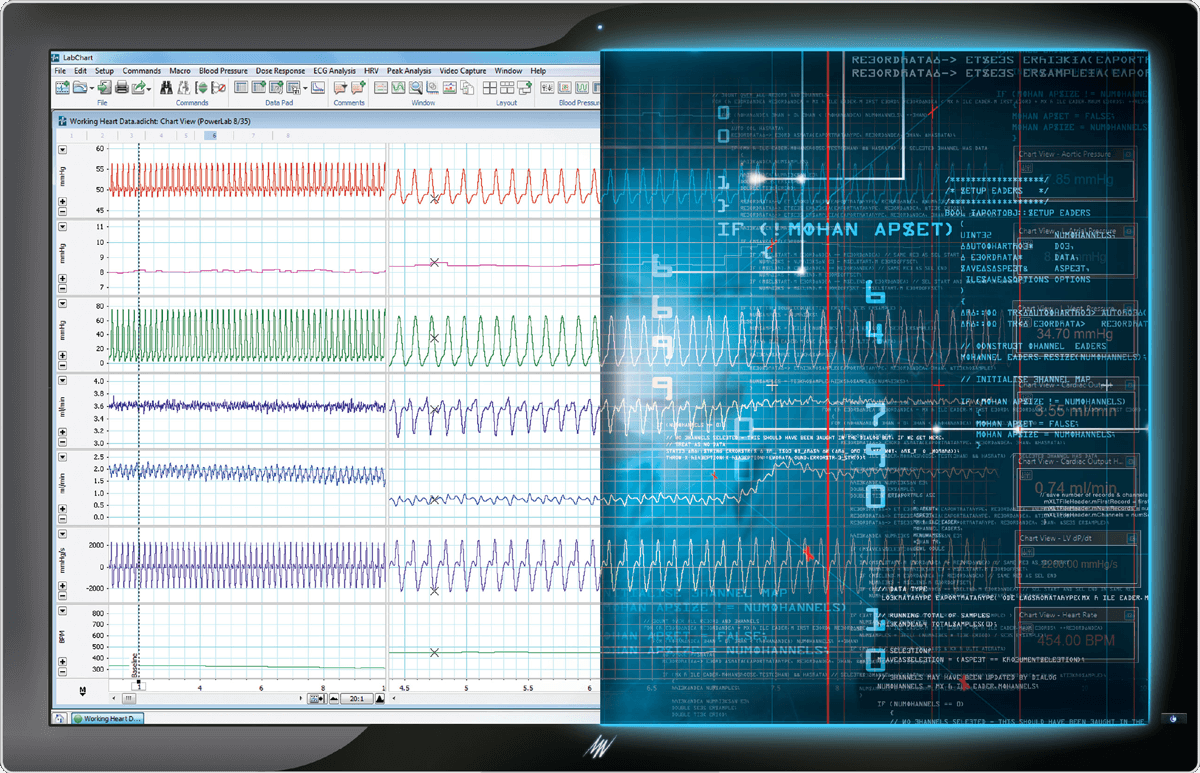
LabChart 数据分析软件为所有记录装置的共同协作创建平台,允许您从多个信号源同步采集生物信号,并且随着实验进行,应用高级计算和绘图。
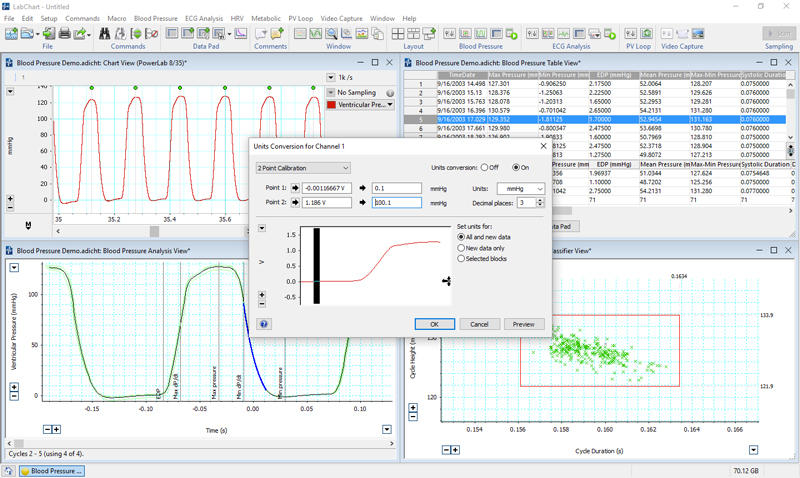
血压和单位转换
仅需几秒,即可在您的心室或动脉血压记录中找到平均动脉压、收缩压、最大 dP/dt 和其他数据。我们的血压模块极为简单,可更快得出结果。借助简便的两点校准工具,即可以快速且便捷的方式将电压单位转换至已知测量单位。
注释、Scope 视图、数据板和数据板绘图
在数据采集过程中或完成后为您的数据进行批注,有助于在之后的数据追踪过程中为您进行导航。借助 Scope 视图,您可实时显示、叠加、平均计算和分析周期或诱发波形。数据绘图功能可让您在 LabChart 记录数据时完成更多操作。数据板则可提供最灵活的方法,将您从图表视图中获得的基于时间的原始数据和计算转换为离散值并用于统计分析。
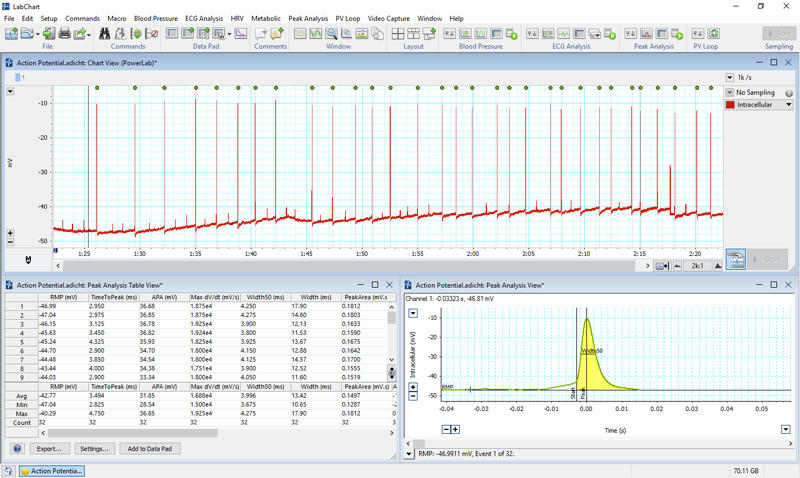
峰值分析
您绝不可小觑这一分析工具。该分析工具适用于一般峰值检测任务,并可借助专用的检测算法和灵活的分析程序包,提供如峰高、半值宽度、潜伏期、群峰电位高度、上升时间、面积和 tau等分析参数。(仅适用于 Windows)。
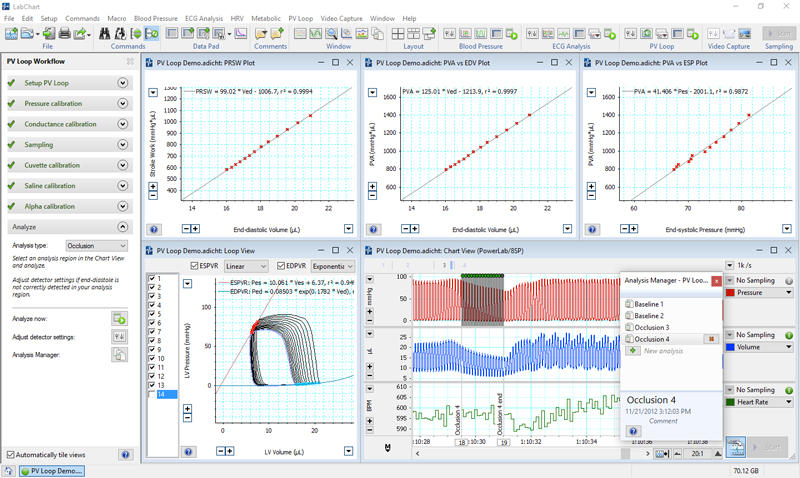
压力容积环 和分析管理器
压力容积环的工作流模式引导您完成压力容积步骤的每个阶段,帮助您获得使用这款功能强大的心血管应用所需的结果。借助分析管理器,您可以保存及标示您的选择和分析区域,仅需轻点即可恢复。
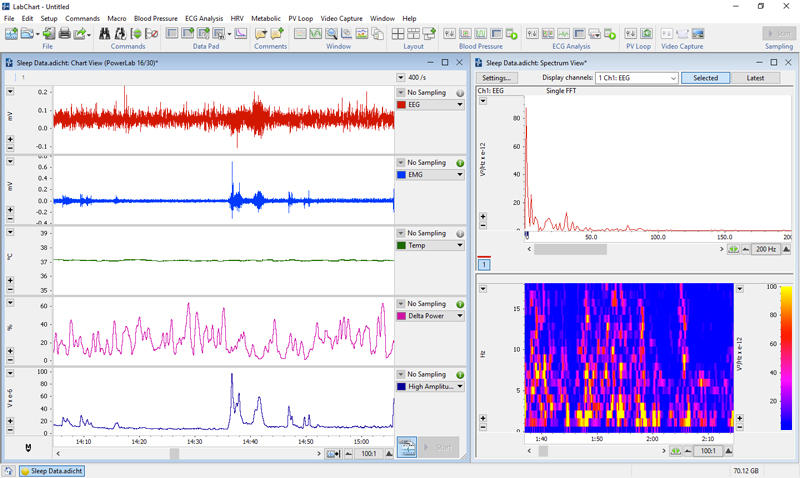
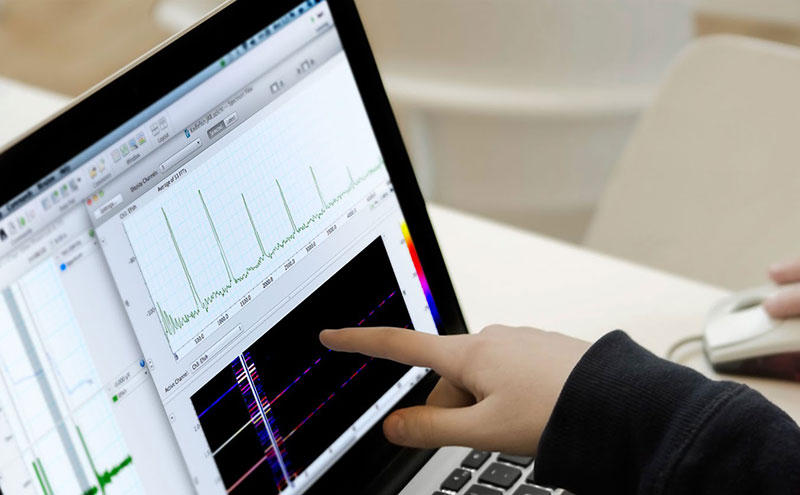
>频谱视图和算法
强大的频谱视图可将您基于时间的信号转换为其组成频率。借助我们超强大的通道计算功能—算法,您可以查看 LabChart 的计算引擎,实现公式、检测和分析定制。您可直接引用课本或论文中的方程式,并在 LabChart 中创建同一方程式。
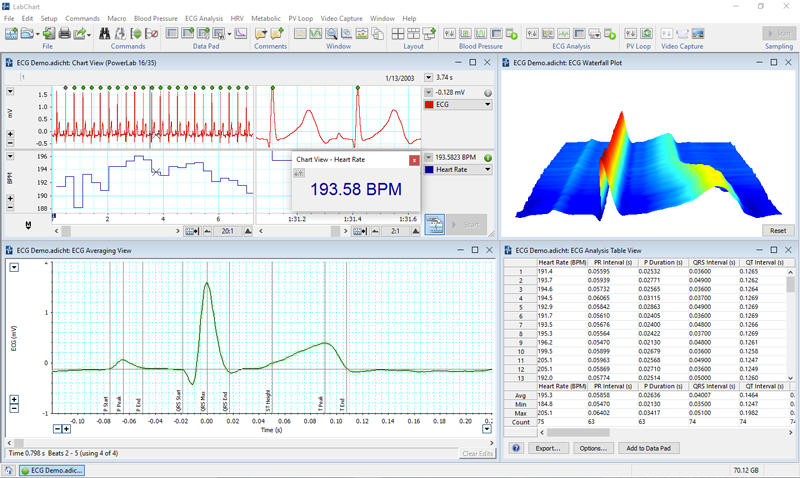
分屏视图、DVM、心电图分析、周期测量
分屏视图显示带有两个单独的 x 轴显示的图表视图曲线。借助这一美观、智能的显示功能,您可查看长期趋势和最新数据。心电图分析可运用自动波形检测与分类使 PQRST 波分析变简单。DVM 和周期测量可提供不同的分析选项。
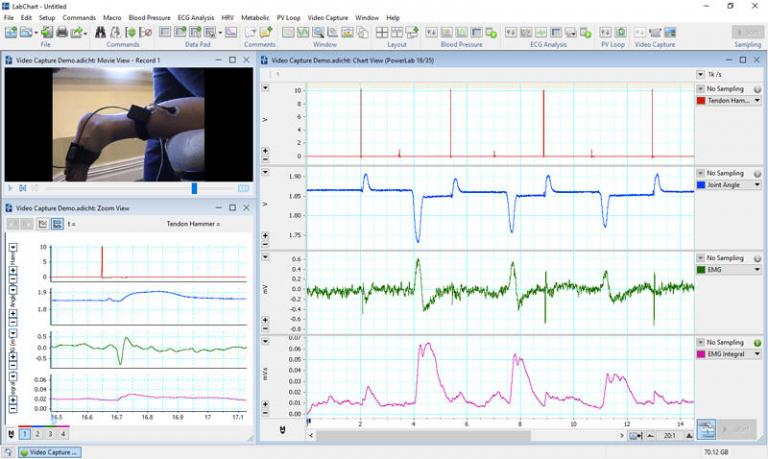
视频捕捉、缩放视图和通道计算
在您进行生理记录时录制和重放同步视频。借助缩放视图,您可以近距离观看事件,将两个重叠通道的时间进行对比及导出并发表您的图像。您可快速更改当前所显示的通道或添加一个计算。
![]()
简单易用
LabChart 易于操作,为您实现基本的功能。先进的功能完美地契合您的需求。
![]()
定制您的工作流
让 LabChart 按照您所需要的方式进行工作。使用编程和自动化(仅适用于 Windows),定制算法,并以各种格式导入或导出数据用于其他应用程序。
![]()
功能多样
LabChart 拥有一系列高级的插件,专为检测生命科学领域的特殊信号而创建,例如:心血管、呼吸、血压、神经和剂量反应数据。
操作快捷、易于使用,助您全面管理您的数据
- 适用于一键记录的预配置设置文件
- 智能检测所有 ADInstruments 外围设备
- 仅需轻点欢迎中心,即可获取您的所有文件、支持服务和全新软件功能。
- 手动或事件驱动采样
- 专用信号分析工具
- 可完全定制的刺激器控制
- 全布局控制 – 仅显示您需要显示的内容
- 轻松修改信号检测算法
- 设置热键宏指令,自动进行重复任务(仅适用于 Windows)。
- 用于自定义信号分析的脚本环境(仅适用于 Windows)。

LabChart 8 新功能
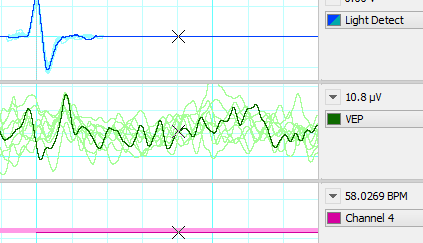
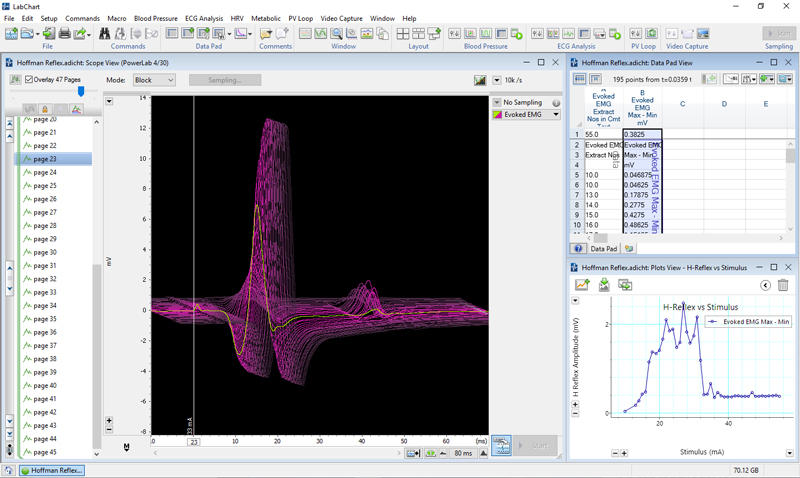
Scope 视图
使用 PowerLab,即可轻松获得数字存储示波器所提供的显示和分析功能。适用于如视觉诱发电位或诱发 EMG 等周期波形。
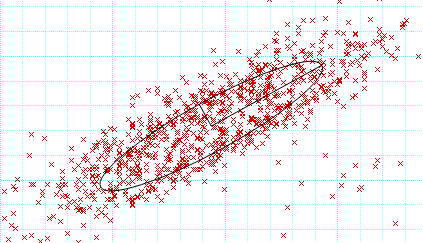
HRV 2.0
这套全面的分析视图包括血流速度图、RR 和增量 RR 间期直方图、庞加莱和功率谱窗口。
学生注册码
获取学生适用的专业研究级软件。
持续为您提供支持,在您需要时提供培训
我们的专家将提供一对一服务,为您在使用 LabChart 实现您的研究和教育目标时提供支持。
拥有丰富的产品知识和经验的科学家,通过手把手教学的方式,为具备不同能力和经验的用户提供实践培训课程。
LabChart 客户对我们的培训的评价
“我们的培训师能力出众,知识渊博,态度友好。我希望他可以在将来提供高级别的 LabChart 培训课程。”
Nor-Fasihah Azam
马来西亚理科大学
“该课程让我对 LabChart 的功能有了新的理解,使我在帮助学生解决软件问题时更加自信。过去,我往往会让学生找导师来解决他们的问题。而现在,我认为自己能以更佳的方式为学生提供帮助。感谢 ADI。”
Karn Hinton
奥克兰大学